April 10, 2024
#2918: Tick Marks explain

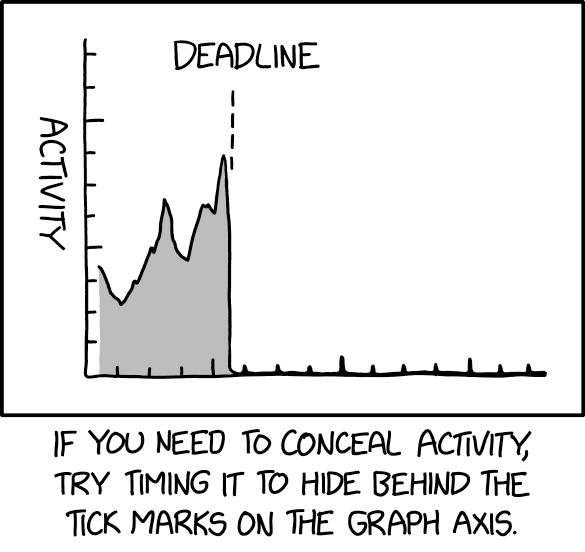
[A graph with two axes is shown. Each axis has tick marks with every fourth mark a bit longer than those in between. The Y-axis is labeled with text rotated 90 degrees clockwise. There is no label on the X-axis. The graph is a jagged curve with three clear peaks; the area beneath the curve is shaded in light gray. After the third and highest peak the curve drops to zero. At the point of decline, a dotted line goes up to a label above the last peak. To the right of this dotted line, the X-axis and the ticks on it are clearly thicker than the axis and the ticks to the left.]
Y-axis: Activity
Label: Deadline
[Caption beneath the panel:]
If you need to conceal activity, try timing it to hide behind the tick marks on the graph axis.