February 9, 2024
#2892: Banana Prices explain

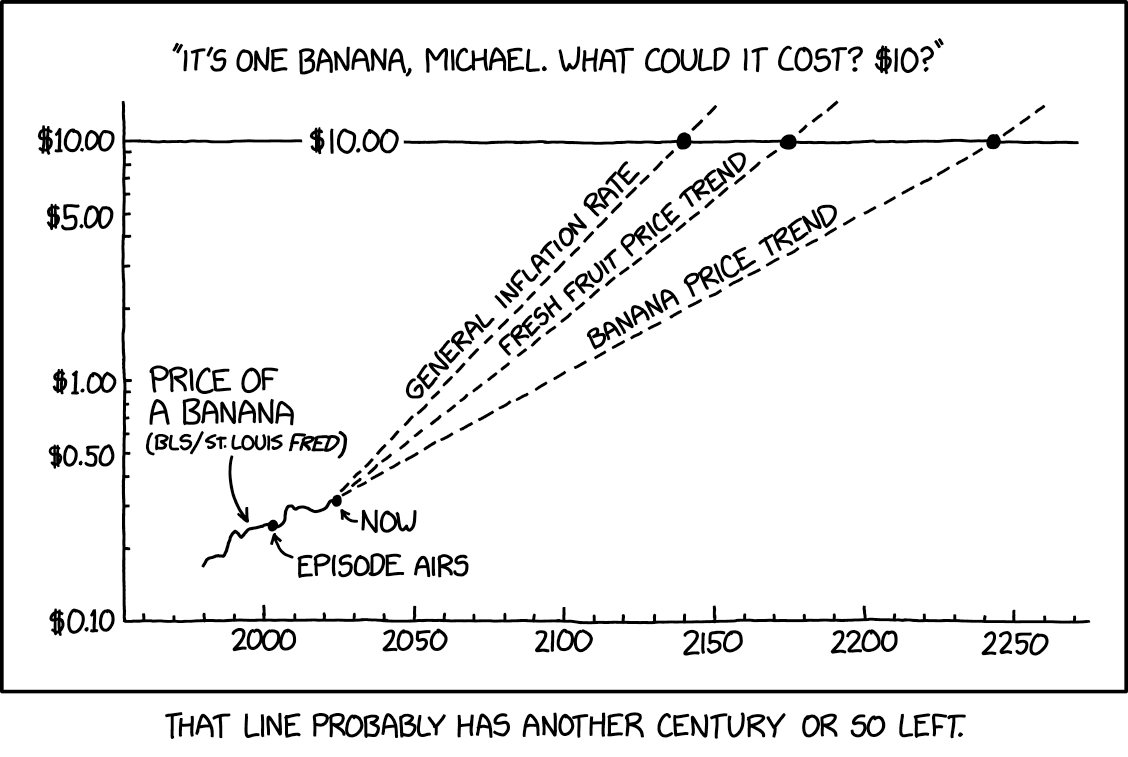
[A graph with the x-axis showing time, from the years 1950 to around 2275. The y-axis is a log scale showing the price of a banana from $0.10 to over $10.00. A label called “Price of a banana (BLS/St. Louis Fredshow a rising trend in the price of a banana. There are two dots on that trend. One is labeled “Episode airs” and the other one “Now”. 3 extrapolations shown as dashed lines labeled “General inflation rate”, “Fresh fruit price trend” and “Banana price trend”, each with progressively less slope. THey extend until reaching the $10 mark, indicated by 3 dots on the $10 line.”)
[Caption above the graph:] “It’s one banana, Michael. What could it cost? $10?”
[Caption below the panel:] That line probably has another century or so left.