February 12, 2024
#2893: Sphere Tastiness explain

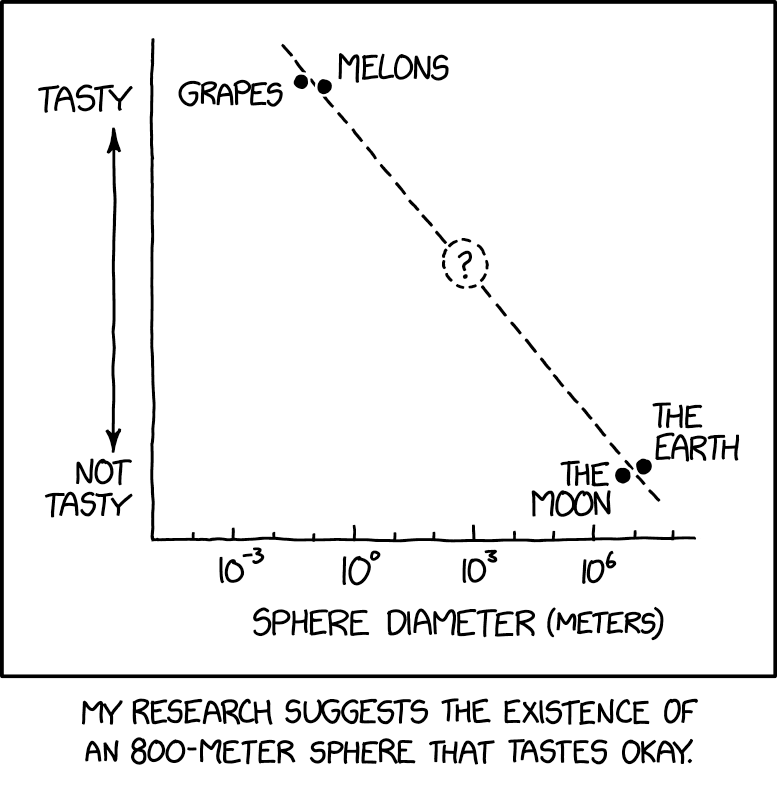
[Graph with Y axis using an arrow indicating tastiness from “Not Tasty” to “Tasty” and X axis labeled “Sphere Diameter (meters)” with a logarithmic scale running from 10-5 to around 108 (with 10-3, 100, 103 and 106 labeled).]
[The graph contains two points for “Grapes” and “Melons” at the “Tasty” end of the Y axis, between 10-2 and 10-1 meters, and two points for “The Earth” and “The Moon” at the “Not Tasty” end, both around 107 meters. A straight dashed line shows a linear interpolation between the points. There’s a circle with a question mark about halfway between them.]
[Caption below the panel:]
My research suggests the existence of an 800-meter sphere that tastes okay.