January 8, 2024
#2878: Supernova explain

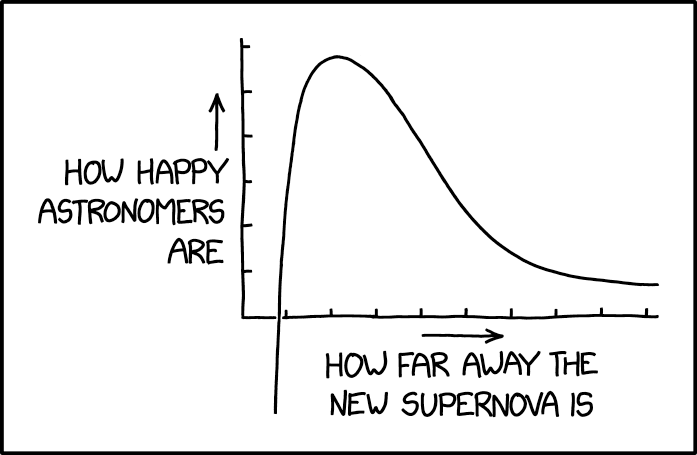
[A graph is shown where the axes are labeled and arrows are pointing upward above the Y axis label and to the right above the X axis label. There is a single line on the graph that peaks close to the Y axis, where it reaches close to the top of the drawn part of the Y axis. Then the line approaches the X axis asymptotically towards the far right. But closer to the Y axis, the peak line goes almost vertically down, and continues far below the “bottom of the chart”, outside of the boundary of the graph that was only supposed to be above the X axis.]
Y axis: How happy astronomers are
X axis: How far away the new supernova is