January 16, 2023
#2725: Sunspot Cycle explain

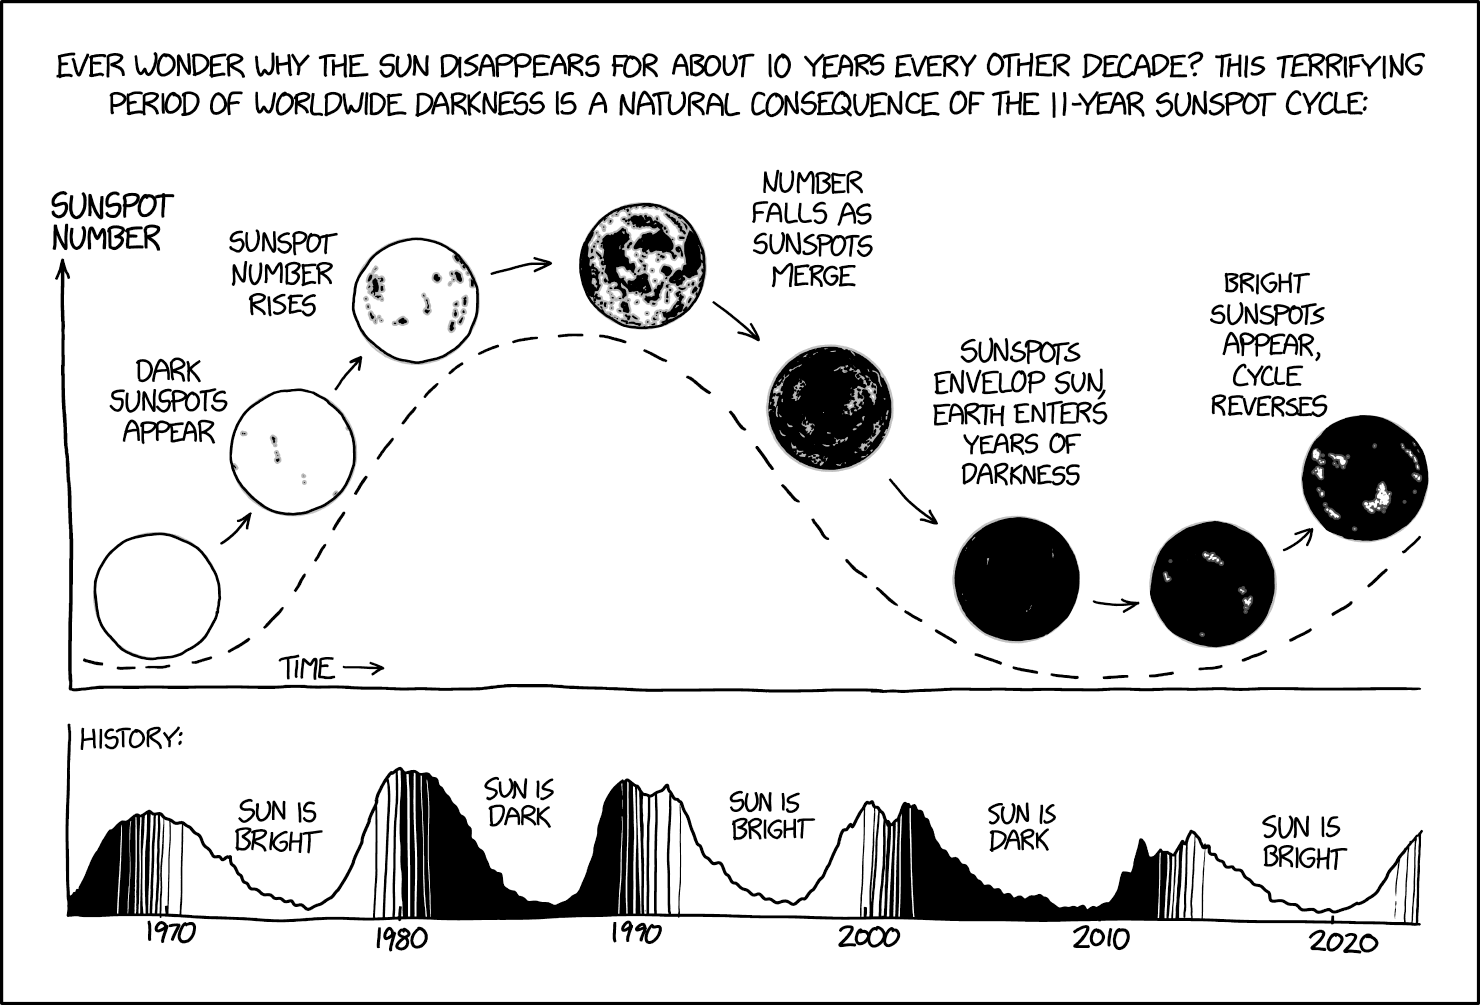
[This comics shows two graphs, one also with several images of the Sun in different times in the solar cycle. The top graph is much larger than the bottom graph, and above them is a explanation of what the graphs shows:]
Ever wonder why the sun disappears for about 10 years every other decade? This terrifying period of worldwide darkness is a natural consequence of the 11-year sunspot cycle:
[A graph is shown with a label above the arrow on the Y-axis and a label written above the left part of the X-axis with an arrow pointing from it to the right (there is no arrow on the X-axis line). The graph shows a sine curve with a dashed line. It starts close to the bottom and then increases, then decreases before it finally slightly increases again. Above the dashed line are eight circles representing the sun with various levels of sunspots, with an arrow between each circle pointing to the next to the right. All circles are just above the dashed curve and the small arrows between them also follow the curvature of the line, so this string makes the same shape as the curve. along the eight representation of the sun there are five labels. The eight Suns are described below with labels given when relevant.]
Y-Axis: Sunspot number
Y-Axis: Time
[The first Sun’s circle is completely white.]
[The second Sun’s circle has a few sunspots. A label is written to the left of it:]
Dark sunspots appear
[The third Sun’s circle has several sunspots. A label is written to the left of it:]
Sunspot number rises
[The fourth Sun’s circle is half covered in sunspots.]
[The fifth Sun’s circle is mostly black with a few lines of white dots. Between the fourth and fifth circle is a label:]
Number falls as sunspots merge.
[The sixth Sun’s circle is almost completely black with just a few small white spots. A label is written above it:]
Sunspots envelop sun, Earth enters years of darkness.
[The seventh Sun’s circle is mostly black with a few light areas.]
[The eighth Sun’s circle is still mostly black but with some larger white areas. A label is written above and left of it:]
Bright sunspots appear, cycle reverses.
[Below is a second graph with a label written near the top of the Y-axis which is otherwise not labeled. The X-axis also has no label, but six years are written beneath at equal intervals. The graph shows a similar sine curve as the one above, but with almost five cycles shown. Also, each cycle is not close to being a perfect sine curve, but has the property with a peak followed by a trough. The five troughs are labeled. The area beneath the curve alternates from being black and white when there is a trough, with the peak in between having several vertical lines, indicating transfer from black to white and vise versa. There are not same distance between peaks and there are also features on the graphs, for instance the two peaks in the middle has a drop, so they look like volcanoes. And the last full peak has a clear outlier year with many sunspots.]
Label: History:
X-axis labels: 1970 1980 1990 2000 2010 2020
Through 1970-1980: Sun is bright
Through 1980-1990: Sun is dark
Through 1990-2000: Sun is bright
Through 2000-2010: Sun is dark
Through 2010-2020: Sun is bright