June 10, 2022
#2631: Exercise Progression explain

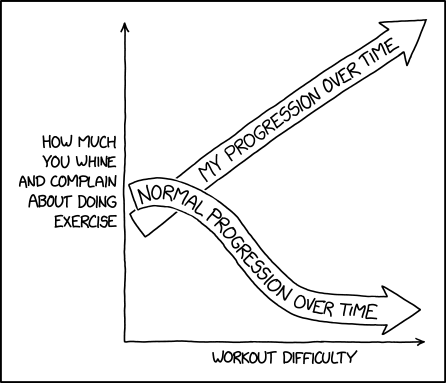
[A graph is shown with labelled axis, and arrows at the tip of each axis. There are two thick arrows plotted, both starting mid-range on the Y-axis, one of them goes upwards at a constant angle of about 40°. The other, which lies over the first mentioned where they overlap close to the Y-axis, first rises a bit before it bends downward and then after having increased its downward bend for a bit it changes to a continuously lower down bending rate and seemingly converges towards a constant y-value close to zero before the end of the graph. Both arrows tip ends at the end of the X-axis. Inside each arrow there is a label.]
Y-axis: How much you whine and complain about doing exercise"
X-axis: Workout difficulty
Upwards arrow: My progression over time
Downwards arrow: Normal progression over time