December 14, 2022
#2711: Optimal Bowling explain

[The header is surrounded on either side by small drawings of two bowling pins and a bowling ball.]
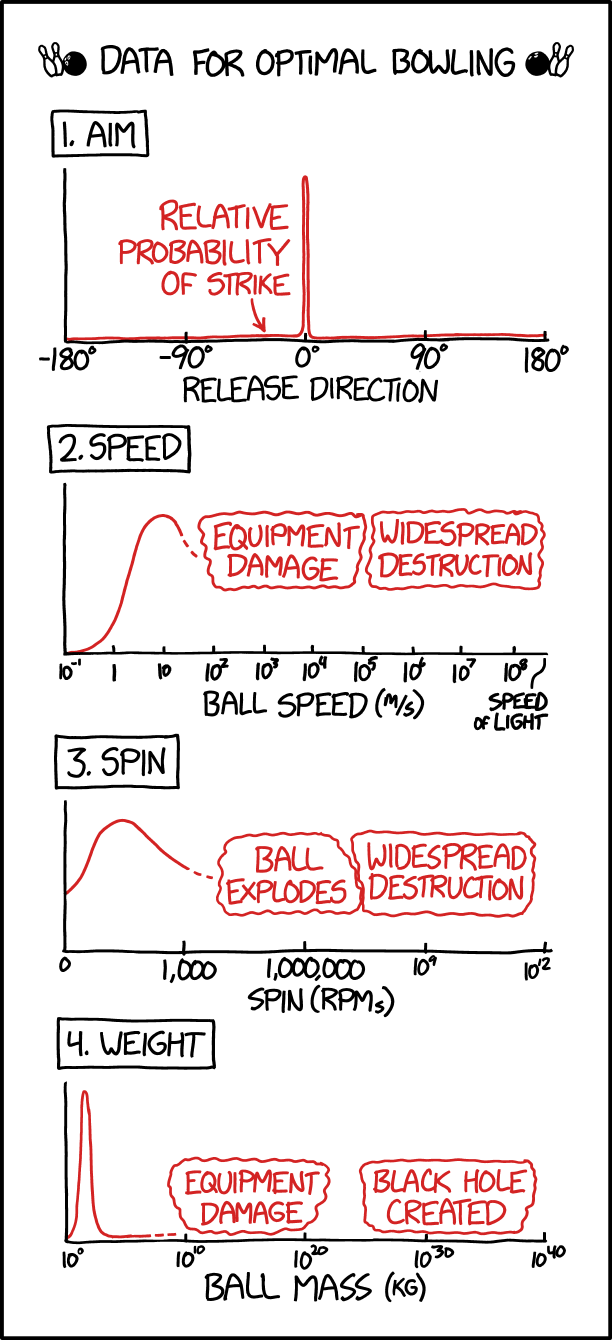
Data for Optimal Bowling
[Four line graphs are depicted. Each has a numbered one-word general description in a box at the top, an unlabeled y-axis, and a labeled x-axis. The relevant curve and other comments on each graph are in red.]
- Aim
[The graph’s x-axis is labeled from -180° to 180°.]
Release Direction
[The red curve on the graph is just above the x-axis at all points except for a steep peak around 0°. The red curve is labeled:]
Relative Probability of Strike
- Speed
[The graph’s x-axis is labeled from 10-1 to 108, with the last point on the x-axis labeled “Speed of Light”.]
Ball Speed (m/s)
[The red curve on the graph starts at the x-axis for 10-1, reaches its peak around 10, then declines and becomes a dashed line ending around three-quarters of the peak around 102. The remainder of the curve is replaced by two labels:]
Equipment Damage [from approximately 102 to approximately 105]
Widespread Destruction [from approximately 105 to the end of the axis]
- Spin
[The graph’s x-axis is labeled from 0 to 1012.]
Spin (RPMs)
[The red curve on the graph starts about halfway from its peak for 0, reaches its peak somewhere between 0 and 1,000, then declines and becomes a dashed line around 1,000, soon after which the remainder of the curve is replaced by two labels:]
Ball Explodes [from approximately 10,000 to approximately 107.5]
Widespread Destruction [from approximately 107.5 to the end of the axis]
- Weight
[The graph’s x-axis is labeled from 100 to 1040.]
Ball Mass (kg)
[The red curve on the graph starts just above the x-axis for 100, rises steeply and drops steeply ending just above the x-axis, then becoming a dashed line, all before reaching 1010. The remainder of the curve is replaced by two labels:]
Equipment Damage [from approximately 109 to approximately 1022]
Black Hole Created [from approximately 1025 to the end of the axis]