November 21, 2022
#2701: Change in Slope explain

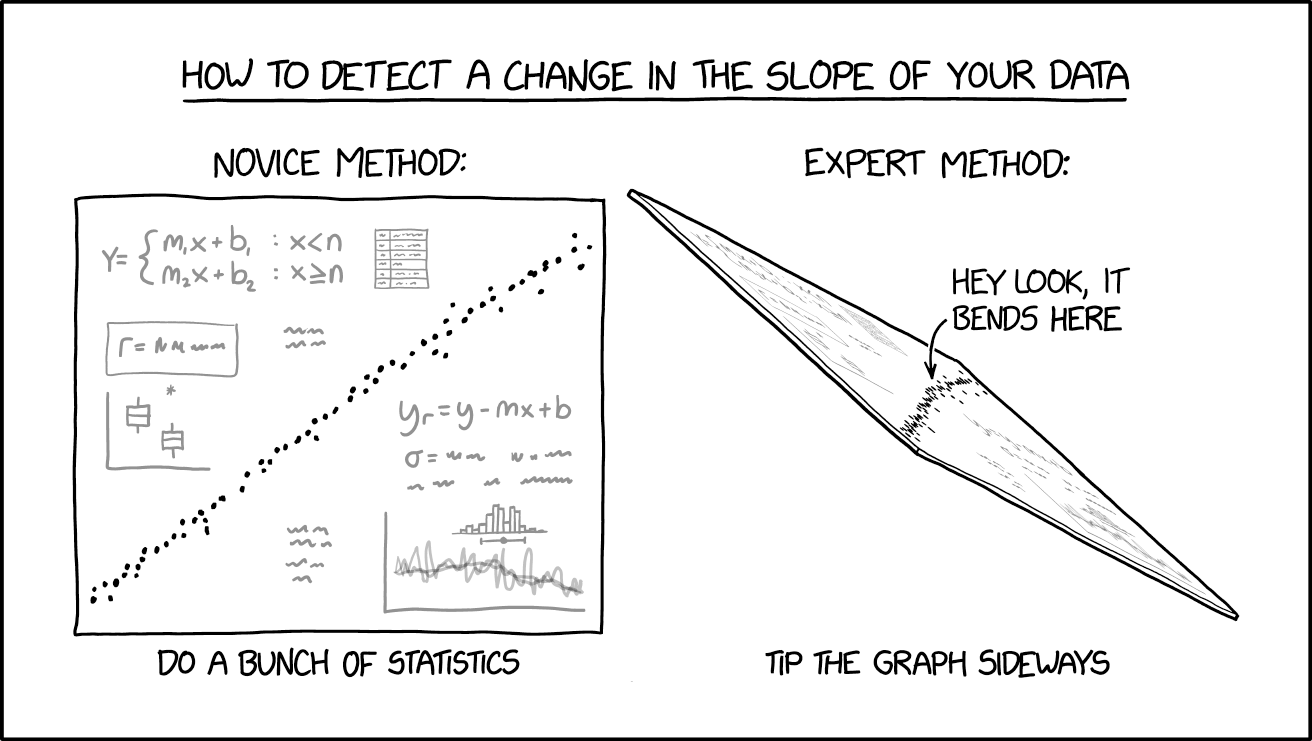
How to detect a change in the slope of your data
[First column, on the left]
Novice method:
[A graph, with dots forming a rough line, math formulas, and sub graphs]
Do a bunch of statistics
[Second column, on the right]
Expert method:
[Perspective view of the previous graph, with the legend “Hey look, it bends here” and an arrow pointing to the graph]
Tip the graph sideways