January 3, 2022
#2563: Throat and Nasal Passages explain

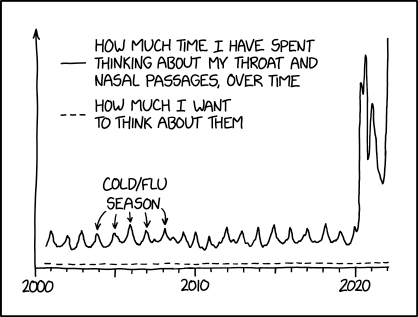
[A graph with two curves are shown. The Y-axis ends in an arrow, but has no units or ticks. The X-axis has no arrow but has 23 ticks with every fifth longer and every tenth labeled. The first tick extends the Y-axis below the X-axis. Both curves start over the second tick and end over the last tick. One curve is a dotted straight line running along the bottom of the graph just above the X-axis. The other start a bit higher and oscillate a bit up and down with 19 sharp peaks and 19 troughs, where some of the troughs have extra features, and not all are equidistant. After this a 20th small peak just starts to drop down again, before the curve goes in to a very steep rise almost all the way to the top of the graph. There is a small dip on the way before it reaches a maximum. Then a deep drop followed by a smaller rise before an even deeper drop. But then at the end, the graph rises almost vertically to the highest point where the graph stops over the last tick. At the top left of the graph the two lines are explained showing a solid and a dotted line with text to their right. Below this, above the solid curve midway between the first two labels on the X-axis, is a label from which 5 arrows points to 5 consecutive peaks.]
- How much Time I have spent thinking about my throat and nasal passages, over time
┅ How much I want to think about them
Label:Cold/Flu Season
X-axis: 2000 2010 2020