January 8, 2021
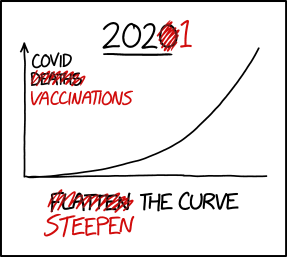
#2409: Steepen the Curve explain

[Line graph shown with a rising curve drawn in black. There is an underlined label above and another label below the graph. The Y-axis line is ending in an arrowhead and also has a label. All this is in black. But the last number in the upper label as well as one word in each of the other two labels, have been scribbled out in red and then another number or word has been written behind or beneath in red.]
[Caption above the graph:]
2020 1
[Y-Axis:]
COVID Deaths Vaccinations
[Caption below the graph:]
Flatten Steepen The Curve