July 1, 2020
#2327: Oily House Index explain

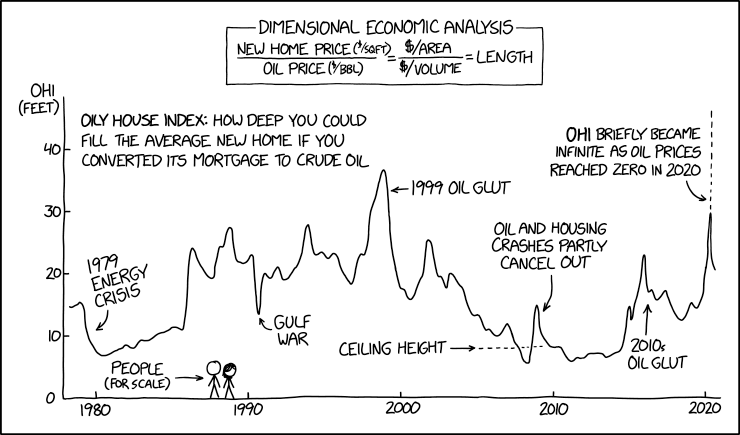
[A line graph is shown. Above it is a rectangular frame with formulas inside. Most of the top part of the frame is removed and instead a heading is written over the missing section of the frame. The formula is written in three parts, with the first two parts having a division line with text written above and below.]
Dimensional economic analysis
New home price ($/sqft) / Oil price ($/BBL) = $/area / $/volume = Length
[The graph has a labeled Y-axis with four ticks, which have values, and also the origin has a value. The X.axis is a time-line without label. There are five labeled ticks.]
X-axis: 1980 1990 2000 2010 2020
Y-axis label: OHI (feet)
Y-axis: 40 30 20 10 0
[Above the line graph there is a caption:]
Oily House Index: How deep you could fill the average new home if you converted its mortgage to crude oil
[The graph begins around 15 before 1980, then dips below 10, rises slowly until about 1988 when it rises sharply. It stays high but has several peaks, and one deep valley until 1999 when there is a very high peak, which then drops fast. A few more peaks, and then a decline to the lowest point in 2008, which is followed by a small peak, and then another drop. From there it stays low until 2015 when it rises quite fast and has one very high peak. It then drops of, until 2020 when there is a really sharp peak. Above the top of the peak is a dotted line extending to the top of the graph (i.e. the top of the Y-axis, not the top of the panel). Then it drops down but not very low as it reaches the present.]
[There are six labels with arrows pointing from them to notable peaks and valleys along the graph. They are written both above and below the line. From left to right they are:]
1979 energy crisis
Gulf War
1999 oil glut
Oil and housing crashes partly cancel out
2010s oil glut
OHI briefly became infinite as oil prices reached zero in 2020
[From 2005-2010 there is a dotted horizontal line that hits the valley at 2008. This is labeled with an arrow pointing to it:]
Ceiling height
[Below the line is a drawing of Cueball and Megan standing on the X-axis near 1990. Next to them is a label with an arrow pointing to them:]
People (for scale)