May 25, 2020
#2311: Confidence Interval explain

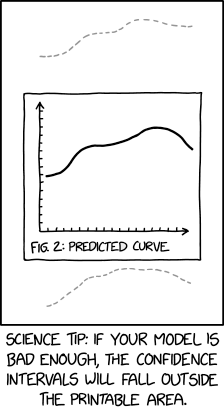
[A graph is shown in the middle of the panel with a square frame around it. The graph has two unlabeled axes with ticks along both axes, and the axes end in arrows. A solid line graph is shown starting around the middle of the Y axis, going up and flattening twice before falling down towards the right. Far above and just below the frame around the graph are two gray dotted lines, following the same trend as the original but not identical copies.]
Fig. 2: Predicted Curve
[Caption below the panel:]
Science tip: If your model is bad enough, the confidence intervals will fall outside the printable area.