May 18, 2020
#2308: Mount St. Helens explain

[Caption above graph:]
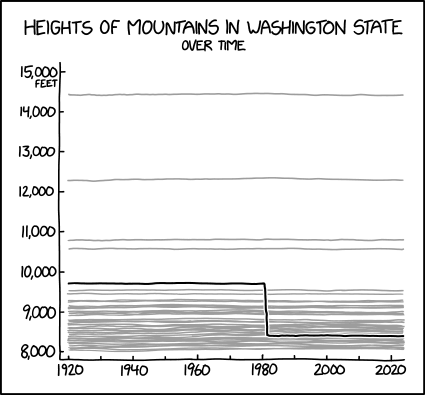
Heights of mountains in Washington State
Over time
[A graph is shown with close to 30 horizontal gray lines which seem not to change much, if any, as they go from left to right. Only the top 6 gray lines are distinctly separated from others. The top line is way above the second line which again is far above the next two that are close together. Two more close together is somewhat further down, and just below them the rest of the lines follow in close proximity down to the bottom of the graph. A single black line is also shown. It begins as the fifth highest line, just above the two last mentioned above. It, like all other lines, goes horizontally, but only three fifths of the way across the graph – then it immediately drops down well below most of the other lines (at 1980) and levels off, continuing on its horizontal path. There is a caption above the graph, and both Y-axis and X-axis has labels. For the Y-axis there is a tick for every label, for the X-axis only every 2nd tick has a label. A unit is given on the top label on the Y-axis.]
[X-axis:]
1920 1940 1960 1980 2000 2020
[Y-axis:]
15,000
feet
14,000
13,000
12,000
11,000
10,000
9,000
8,000