February 26, 2020
#2273: Truck Proximity explain

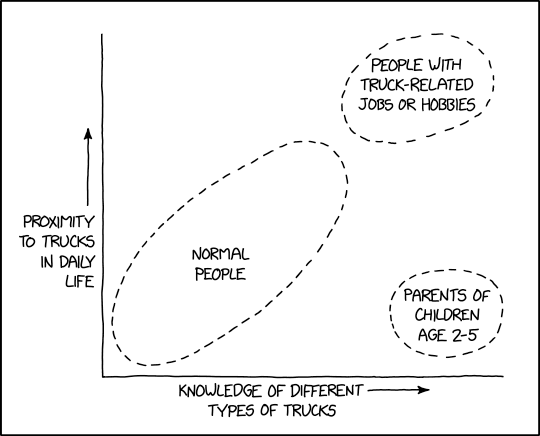
[A chart is shown with two axes. Each axis has a label with an arrow pointing from the label towards higher values. No values are shown.]
X-axis: Knowledge of different types of trucks
Y-axis: Proximity to trucks in daily life
[Three sections are marked on the chart with dotted lines, drawn in imperfect ellipses. The first two circumscribe areas along the diagonal X=Y. A large one takes up about two thirds of the length starting from the origin, and a smaller one is separated a bit from the first one, but continuing the trend of X=Y. This takes up less than a third at the top right. Below this, close to the X-axis is a third even smaller section, its outer edge is as far to the right at the one at the top. Each of these three sections has a label written inside. From largest to smallest these are:]
Normal people
People with truck related jobs or hobbies
Parents of children age 2-5