December 16, 2020
#2399: 2020 Election Map explain

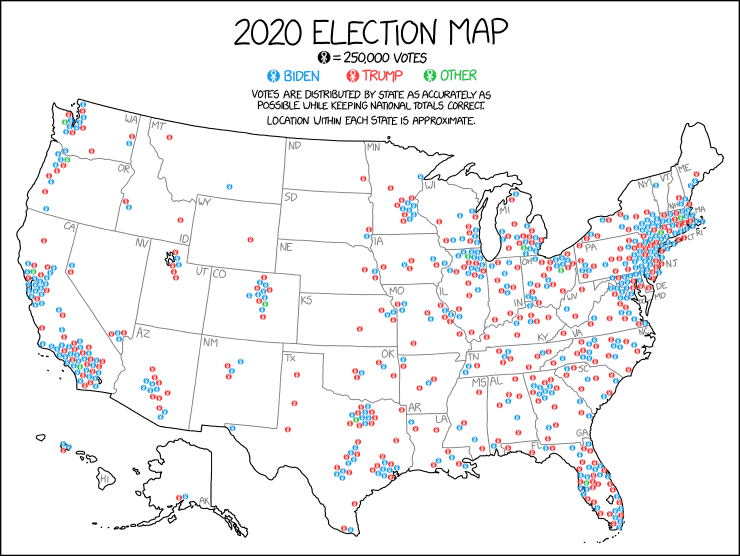
2020 Election Map
[One stick figure in a black circle] = 250,000 votes
[Stick figure in a blue circle] Biden</font color>
[Stick figure in a red circle] Trump</font color>
[Stick figure in a green circle] Other</font color>
Votes are distributed by state as accurately as possible while keeping national totals correct.
Location within each state is approximate.
[Blue, red, and green circles are distributed across a map of the United States.]