November 23, 2020
#2389: Unread explain

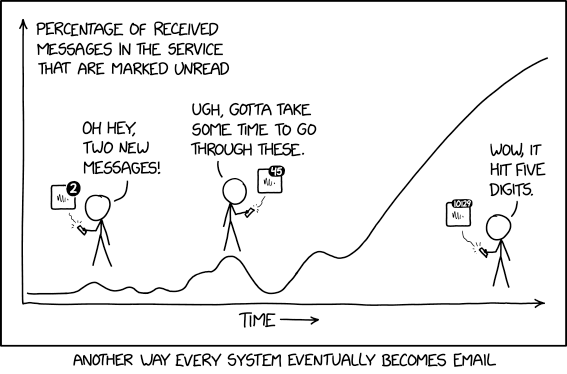
[A graph with the x-axis and y-axis labeled]
[The graph has a line that starts near the bottom of the x-axis, fluctuates a little, then steadily increases until it is approaching the maximum of the y-axis, whereby it begins to level out]
Percentage of received messages in the service that are marked unread
Time —>
[Three Cueballs standing at different points on the graph. The first two are shown directly above the line at the beginning and middle areas, and the third is shown below it near the end of the graph. All three are holding phones.]
[The first Cueball looks at his phone, which displays two notifications on an app]
Oh hey, two new messages!
[The next Cueball again looks at his phone, this time with 45 notifications on the app]
Ugh, gotta take some time to go through these.
[The last Cueball’s phone app shows 10129 notifications]
Wow, it hit five digits.
[Caption below the panel]
Another way every system eventually becomes email