November 4, 2019
#2224: Software Updates explain

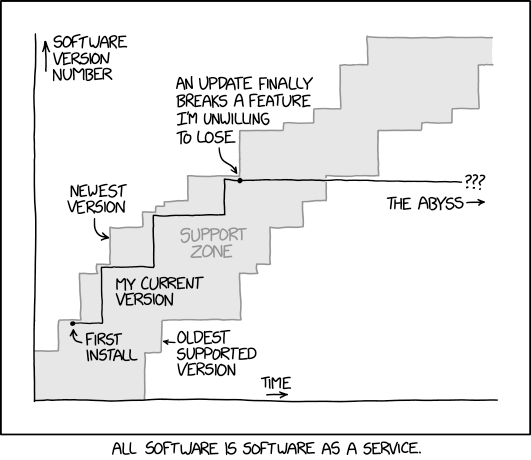
[A graph with two axes. Over and right of the axes are two labeled arrows pointing along the two axes:]
X-axis: Time
Y-axis: Software Version Number
[The graph consists of three lines. Two gray lines moves in upwards step from left to right. The upper line begins a bit up the Y-axis, the bottom line begins somewhat down the X-axis. From there both lines move upwards in steps of different height. The distance between them stays on average about the same for the entire graph, but moves from bottom to top of the graph. Labeled arrows point to the top and the bottom gray line. The area between them is shaded light gray and has a gray label written in the middle. The third line is black. It begins from a dot just under the second step in the upper gray line. This line also makes steps, keeping close to the upper line, although it makes fewer steps than that line. But a bit over halfway to the top, it stops stepping, staying on the same level for the rest of the graph; thus eventually it falls outside of the light gray area between the other two lines, where it had been until the bottom line stepped above it. This black line is also labeled, with normal black text written beneath the first full step inside the gray area. There is one other point labeled on the black line: a dot just after the final step, under the next large step in the upper gray line. At the end of the black line there are question marks with an arrow beneath pointing right. The arrow has a label to the left.]
Upper gray line: Newest Version
Bottom gray line: Oldest Supported Version
Light gray area: Support Zone
Black line: My current version
Start dot: First Install
Second dot: An update finally breaks a feature I’m unwilling to lose
End of black line: ???
Arrow label: The Abyss
[Caption below the chart]:
All software is Software as a Service.