July 2, 2018
#2014: JWST Delays explain

[Top caption, in the panel:]
James Webb Space Telescope
[Subtitle of top caption:]
Launch Delays
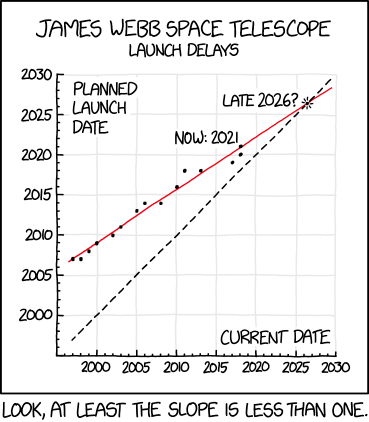
[There is a positive-quadrant only line graph. The x- axis is labeled ‘Current Date’ and the y axis is labeled ‘Planned Launch Date’. The dates on both of the axes range from 1995 to 2030.]
[In the graph are 15 points, starting at (1997,2007) and extending at a slope of a little less than one. The most recent one is labeled ‘Now: 2021’.]
[There are two lines on the graph: a red one and a dashed black one. The red one is a regression of the points on the graph. It has a slope of about ⅔. The black one is a line with a slope of one. They intersect at the point (2026,2026), marked by the label ‘Late 2026?’]
[Caption below the panel:]
Look, at least the slope is less than one.