June 20, 2018
#2009: Hertzsprung-Russell Diagram explain

Expanded Hertzsprung-Russell Diagram
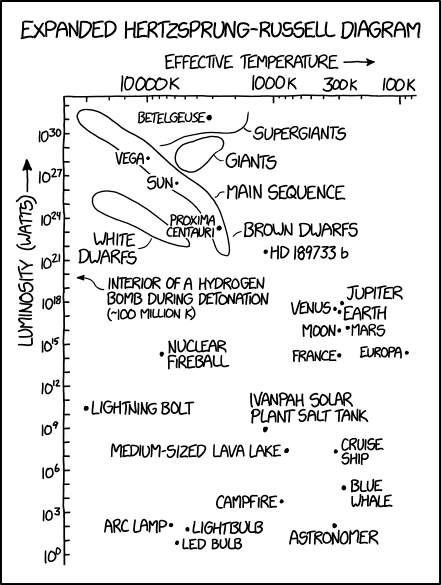
[A scatter plot is shown, with the x-axis labeled Effective Temperature (in kelvins), and the y-axis Luminosity (watts).]
[Circled items in the top left (high temperature and high luminosity):]
Supergiants
Giants
Main sequence
White dwarfs
Brown dwarfs
[Items shown as points and their values:]
Betelgeuse: 3200 K, 1.6 × 1031 W
Vega: 10,000 K, 1.8 × 1028 W
Sun: 5800 K, 3.6 × 1026 W
Proxima Centauri: 2700 K, 2.0 × 10²³ W
HD 189733 b: 2100 K, 4.8 × 10²¹ W
Interior of a hydrogen bomb during detonation: ~108 K, ~1020 W
Jupiter: 285 K, 1.2 × 10¹⁸ W
Venus: 330 K, 5.0 × 10¹⁷ W
Earth: 300 K, 3.0 × 10¹⁷ W
Mars: 255 K, 2.0 × 10¹⁶ W
Moon: 300 K, 1.2 × 10¹⁶ W
Nuclear Fireball: 8000 K, 2.0 × 10¹⁴ W
France: 300 K, 2.0 × 10¹⁴ W
Europa: 90 K, 3.5 × 10¹⁴ W
Lightning Bolt: 30,000 K, 30 GW
Ivanpah Solar Plant Salt Tank: 1200 K, 1.2 GW
Medium-sized Lava Lake: 800 K, 32 MW
Cruise Ship: 325 K, 30 MW
Campfire: 870 K, 7.0 kW
Blue whale: 280 K, 78 kW
Arc lamp: 6500 K, 150 W
Lightbulb: 4800 K, 75 W
LED Bulb: 5800 K, 8 W
Astronomer: 310 K, 100 W