March 12, 2018
#1966: Smart Home Security explain

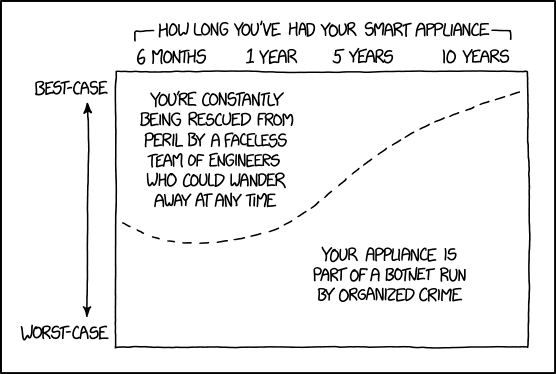
[A graph is shown inside a frame. There is one dotted line going from the middle of the left edge, then dipping slightly before rising slowly at first, then more rapid and finally slowing its ascend down as it nears the top right corner.]
[Above the frame is the title of the x-axis, and from each end of this text, there is a small line going out and then down, to indicate a time range, which is shown below with four times:]
How long you’ve had your smart appliance
6 months 1 year 5 years 10 years
[Along the left part of the frame there runs a double arrow and at the top and bottom of these arrows there are legends at the top and bottom of the panels height:]
Best-case
Worst-case
[Inside the panel there is text above the dotted line to the left, and below the dotted line to the right:]
You’re constantly being rescued from peril by a faceless team of engineers who could wander away at any time
Your appliance is part of a botnet run by organized crime