December 28, 2018
#2091: Million, Billion, Trillion explain

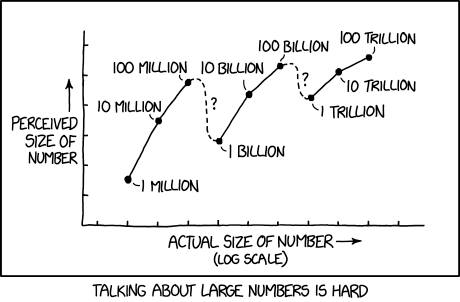
[A graph with Y-axis labeled “Perceived size of number” and X-axis labeled “Actual size of number (log scale)”.]
[The line graph shows points that are labeled with the following numbers from “1 million” to “100 trillion”:]
[Points on graph:]
{| class=“wikitable” style=“text-align: center;”
|1 million
|[(2, 1.5)]
|-
|10 million
|[(3, 3.5)]
|-
|100 million
|[(4, 4.8)]
|-
|1 billion
|[(5, 2.8)]
|-
|10 billion
|[(6, 4.4)]
|-
|100 billion
|[(7, 5.3)]
|-
|1 trillion
|[(8, 4.3)]
|-
|10 trillion
|[(9, 5.1)]
|-
|100 trillion
|[(10, 5.6)]
|}
[The perceived size increases between most numbers, but decreases between 100 million and 1 billion, and between 100 billion and 1 trillion. The decreases are shown as dashed lines labeled “?”, in contrast to the solid unlabeled lines between the increases. The increases and decreases in perceived size become smaller as the numbers grow in actual size.]
[Caption below the panel:]
Talking about large numbers is hard