January 8, 2018
#1939: 2016 Election Map explain

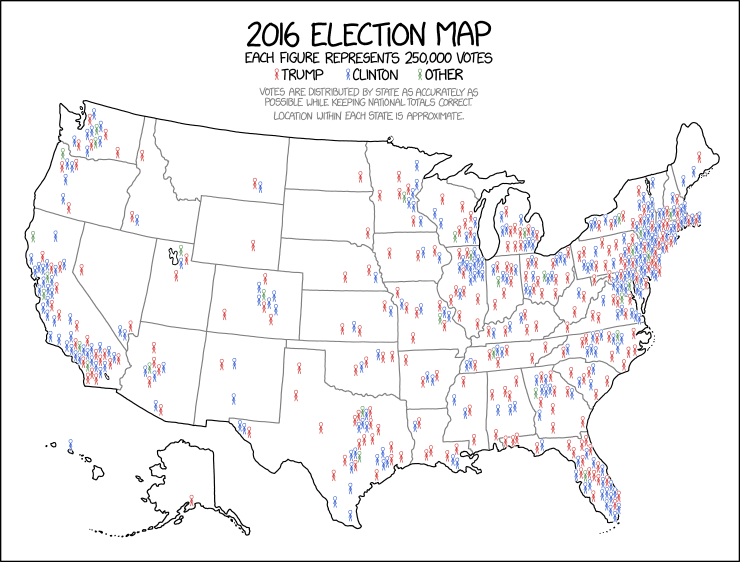
[A map of the United States, with Hawaii and Alaska offset, is shown. Across the states red, blue and green Cueball like stick figure are scattered about, much more on each coast, and very few in the central parts, especially in the mid west. There are about the same amount of red and blue stick figures. There are not many green, but they are represented almost in any state with more than 10 stick figures. Above the map there is a large bold title. Below that there is a legend description explaining the red, blue and green Cueball stick figure with labels of who they represent next to them. Below this, in light gray text, are two lines of explanation of how the map was created:]
2016 Election Map
Each figure represents 250,000 votes
[Red stick figure:] Trump
[Blue stick figure:] Clinton
[Green stick figure:] Other
Based on 2016 election results
Votes are distributed by states as accurately as possible while keeping national totals correct.
Location within each state is approximate.