May 3, 2017
#1832: Photo Library Management explain

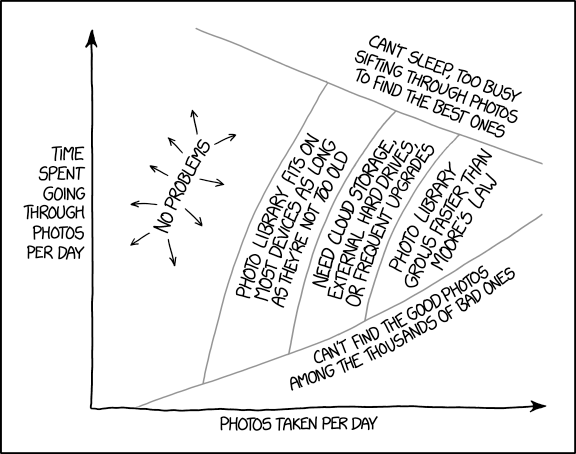
[A line graph is shown. The x-axis is labeled “Photos taken per day” and the y-axis is labeled “Time spent going through photos per day”. The content is divided into six sections:]
[Section 1: Few photos taken per day, no limit to time spent:]
“No problems”
[Section 2: Some photos taken per day, a limited amount of time spent going through:]
“Photo library fits on most devices as long as they’re not too old”
[Section 3: More photos taken per day, less time spent going through:]
“Need cloud storage, external hard drive, or frequent upgrades”
[Section 4: A lot of photos taken per day, and even less time spent going through:]
“Photo library grows faster than Moore’s Law”
[Section 5: Above line increasing where more time is spent as more photos are taken:]
“Can’t find the good photos among the thousands of bad ones”
[Section 6: Below line of negative gradient, as number of photos increases and time decreases:]
“Can’t sleep, too busy sifting through photos to find the best one”