May 10, 2017
#1835: Random Obsessions explain

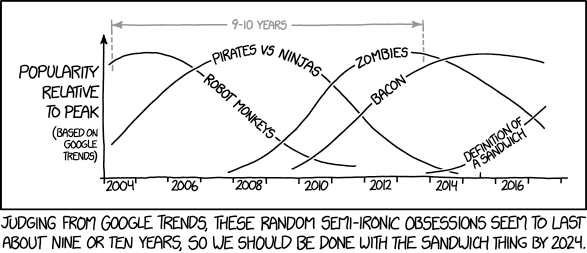
[The comic shows curves plotted in an (x,y)-plane. The x-axis shows years from 2004 to 2017, with every even year labeled. The y-axis is labeled “popularity relative to peak (based on google trends)”. There are five vaguely bell-shaped curves, each stretching over 9-10 years. It is implied that they rise from a value close to zero, to which they also return.]
The curve labeled “robot monkeys” peaks in early 2005 and ends near the x-axis in late 2011.
The curve labeled “pirates vs ninjas” peaks in late 2008 and ends in late 2014.
[The remaining three curves all end in mid 2017, the comic release date. ]
The curve labeled “zombies” starts in late 2007 and peaks in early 2013. By 2017 it has fallen to about 30% of its peak value.
The curve labeled “bacon” starts in late 2009 and peaks in mid-2015. By 2017 it shows a value of about 90% of its peak value.
The curve labeled “definition of a sandwich” starts in late 2013 and in 2017 it has reached approximately half its peak value.
[Text below the panel:]
Judging from Google Trends, these random semi-ironic obsessions seem to last about nine or ten years, so we should be done with the sandwich thing by 2024.