October 18, 2017
#1904: Research Risks explain

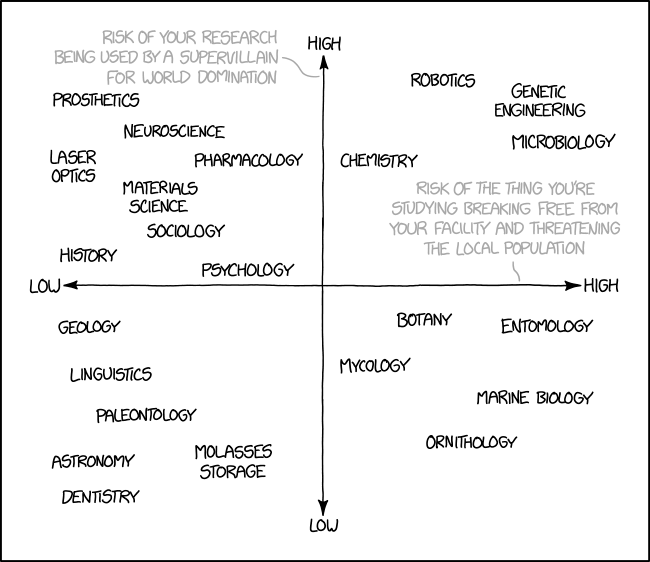
[A chart with two crossing lines with double arrows. Each arrow is labeled:]
Y axis top: High
Y axis bottom: Low
X axis left: Low
X axis right: High
[Near each of the “high” ends of the two axis there is a label written in gray, with a line pointing to the relevant axis:]
Y axis: Risk of your research being used by a supervillain for world domination
X axis: Risk of the thing you’re studying breaking free from your facility and threatening the local population
[The following points are on the charts upper left quadrant (in reading order):]
Prosthetics
Neuroscience
Laser Optics
Pharmacology
Materials Science
Sociology
History
Psychology
[The following points are on the charts upper right quadrant (in reading order):]
Robotics
Genetic Engineering
Chemistry
Microbiology
[The following points are on the charts lower left quadrant (in reading order):]
Geology
Linguistics
Paleontology
Astronomy
Molasses Storage
Dentistry
[The following points are on the charts lower right quadrant (in reading order):]
Botany
Entomology
Mycology
Marine Biology
Ornithology