August 31, 2016
#1727: Number of Computers explain

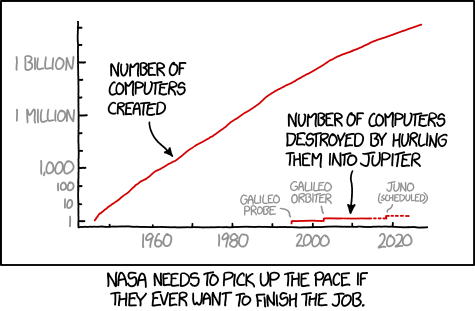
[A graph with two red lines. The X-axis is a time-line with eight ticks with every second tick labeled below the axis, ranging from around 1940 to 2030. The Y-axis is a logarithmic count ranging from 1 to 1 billion. There are 12 ticks with the first and then every third tick after that larger than the two ticks in between. All the large ticks are labeled, but only the first two of the small ticks are similarly labeled. Labels are written to the left of the axis. All labels on both axes are written in gray. The first red line is a straight line (thus exponentially growing), starting close to the bottom left corner eventually reaching the upper right edge of the graph. The other red line begins around 1990 and has three straight steps. Each step is labeled with gray text, the last part of the line (after the present 2016), is dotted. Both of the red lines have an arrow pointing to them with a label above the arrow.]
Left red line: Number of computers created
Right red line: Number of computers destroyed by hurling them into Jupiter
Labels on right red line:
Galileo probe
Galileo orbiter
Juno (scheduled)
Y-axis:
1 billion
1 million
1,000
100
10
1
X-axis: 1960 1980 2000 2020
[Caption below the panel:]
NASA needs to pick up the pace if they ever want to finish the job.