July 1, 2016
#1701: Speed and Danger explain

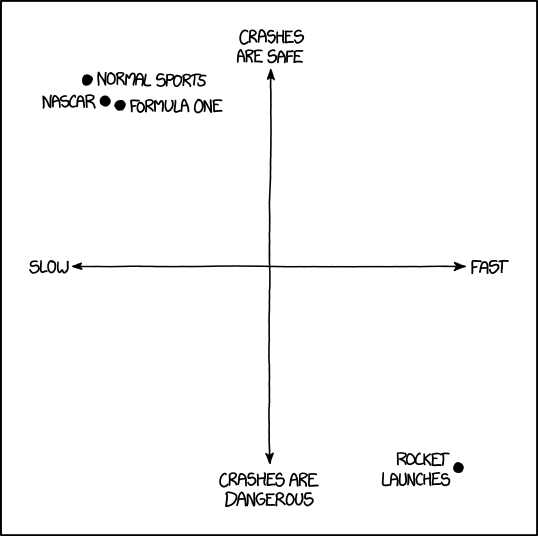
[A two-axis diagram with two double headed arrows centered in the middle of the panel. Each arrow is labeled. There are four large dots in the diagram, three close together in the top left corner and one in the bottom right corner. Each dot is labeled.]
[Y axis:]
Top: Crashes are safe
Bottom: Crashes are dangerous
[X axis:]
Left: Slow
Right: Fast
[Dots from top left to bottom right:]
Normal sports
NASCAR
Formula One
Rocket launches