September 9, 2015
#1575: Footprints explain

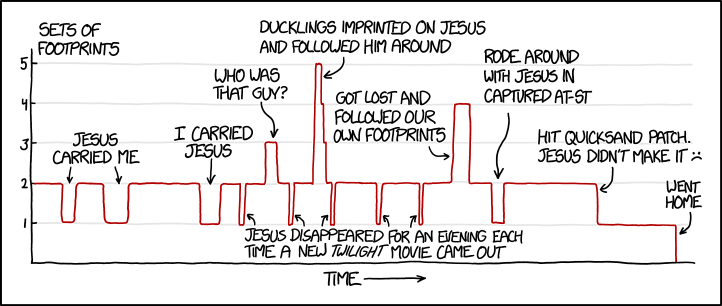
[A graph is shown with a single red line that runs through from left to right, showing different values at different times. Until the very end, the line always returns to the value 2, signifying two sets of footprints in the sand. The X-axis has a label followed by an arrow pointing right. The Y-axis has a label at the top, right of the axis, and numbers, one for each of the ticks from which five thin lines going horizontally across the entire graph. Every time the graph moves away from the value 2 there is an arrow pointing to the event and a label. The first two events has the same label. The only label below the line has five small arrows pointing to five small dips in the curve. All other labels only has one arrow pointing to one event.]
X-axis: Time
Y-axis: Sets of footprints
5
4
3
2
1
[The line starts at the value 2, then dips twice to the value 1. The two troughs are labeled:]
Jesus carried me
[The line dips once again to the value 1. The trough is labeled:]
I carried Jesus
[The line rises to 3 briefly, and is labeled:]
Who was that guy?
[The line rises to 5 sharply, and then falls in a sharp staircase pattern, labeled:]
Ducklings imprinted on Jesus and followed him around
[The line rises to 4, labeled:]
Got lost and followed our own footprints
[The line dips for very short periods five times to the value 1. The first dip is between “I carried Jesus” and “Who was that guy?”, the second between “Who was that guy?” and “Duckings imprinted on Jesus…” and the final three are all between the “Ducklings imprinted on Jesus…” and “Got lost and followed our own footprints”. These five troughs share one label with five arrows from the same text:]
Jesus disappeared for an evening each time a new Twilight movie came out
[The line dips to 1, labeled:]
Rode around with Jesus in captured AT-ST
[The line dips and stays level at 1, labeled:]
Hit quicksand patch. Jesus didn’t make it :(
[The line dips to zero at the end, and is labeled:]
Went home