August 7, 2015
#1561: Water Phase Diagram explain

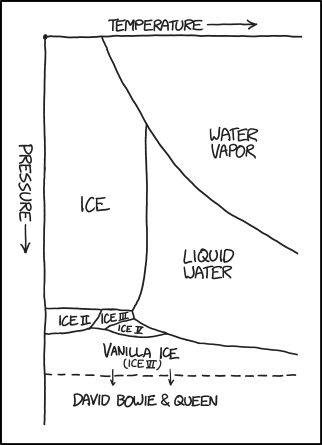
[A phase diagram is shown with eight labeled regions.]
[The horizontal axis, increasing in value to the right is labeled:]
Temperature
[The vertical axis, increasing in value downwards is labeled:]
Pressure
[Region alongside the “Pressure” axis covering about half of its length is labeled:]
Ice
[Region spanning top-right corner of graph, i.e. higher temperatures and lower pressures. The region is labeled:]
Water vapor
[Region below “Water vapor” and to the right of “Ice” is labeled:]
Liquid water
[Three small regions below “Ice” are going from left to right on the same pressure region, the last ending just under “Liquid water”. They are each labeled:]
Ice II
Ice III
Ice V
[Region below “Ice II”, “Ice III”, “Ice V” and “Liquid water” is labeled:]
Vanilla Ice
(Ice VI)
[Below “Vanilla Ice” there is a dashed line with two arrows pointing downwards. The region below the dashed line is labeled:]
David Bowie & Queen