January 26, 2015
#1478: P-Values explain

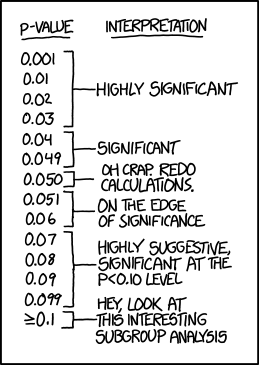
[A two-column table where the second column selects various areas of the first column using square brackets.]
;P-value
Interpretation
;0.001
;0.01
;0.02
;0.03
Highly Significant
;0.04
;0.049
Significant
;0.050
Oh crap. Redo calculations.
;0.051
;0.06
On the edge of significance
;0.07
;0.08
;0.09
;0.099
Highly suggestive, relevant at the p<0.10 level
;≥0.1
Hey, look at this interesting subgroup analysis