August 1, 2014
#1402: Harpoons explain

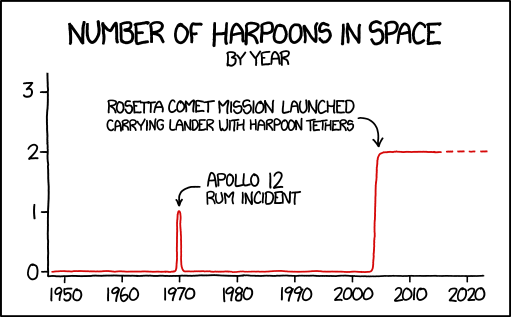
Number of harpoons in space
by year
[A chart with a red graph is drawn below.]
[The y-axis.]
0 1 2 3
[The x-axis.]
1950 1960 1970 1980 1990 2000 2010 2020
[The graph is at zero until a sharp peak to 1 in 1970. The peak is labeled.]
Apollo 12 rum incident
[The graph then stays at 0 until 2004. Then it rises to 2 and stays there until today, continuing as a dotted line after 2014. The rise is labeled.]
Rosetta comet mission launched carrying lander with harpoon tethers