June 9, 2014
#1379: 4.5 Degrees explain

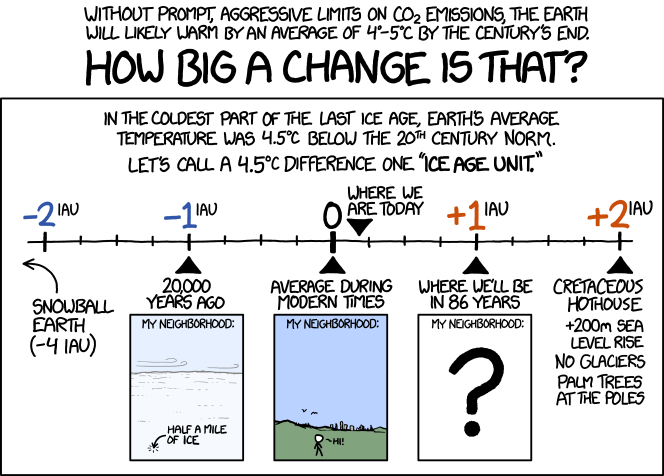
Without prompt, aggressive limits on CO2 emissions, the Earth will likely warm by an average of 4°-5°C by the century’s end.
HOW BIG A CHANGE IS THAT?
[A ruler chart is drawn inside a frame; above the chart is written:]
In the coldest part of the last ice age, Earth’s average temperature was 4.5°C below the 20th century norm.
Let’s call a 4.5°C difference one “Ice Age Unit.”
[A ruler with five main divisions — each again with 3 smaller quarter division markers. Above it the five main divisions are marked as follows with 0 in the middle:]
-2 IAU -1 IAU 0 +1 IAU +2 IAU
[Next to the 0 marking a black arrow points toward 0.25 on the scale and above it is written:]
Where we are today
[The rest of the text is below the ruler.]
[To the far left below -2 IAU a curved arrow points to the left. Below it is written:]
Snowball earth (-4 IAU)
[Below -1 IAU a black arrow points toward this division. Below the arrow is written:]
20,000 years ago
[Below this an image of a glacier. At the top of the image is written:]
My neighborhood:
[At the bottom of the image is an arrow pointing to the glacier.]
Arrow: Half a mile of ice
[Below 0 IAU a black arrow points toward this division. Below the arrow is written:]
Average during modern times
[Below this an image of Cueball standing on a green field with a city skyline in the background. At the top of the image is written:]
My neighborhood:
Cueball: Hi!
[Below +1 IAU a black arrow points toward this division. Below the arrow is written:]
Where we’ll be in 86 years
[Below this a white image. At the top of the image is written:]
My neighborhood:
[Below this is a very large question mark.]
?
[Below +2 IAU a black arrow points toward this division. Below the arrow is written:]
Cretaceous hothouse
+200m sea level rise
No glaciers
Palm trees at the poles