October 8, 2014
#1431: Marriage explain

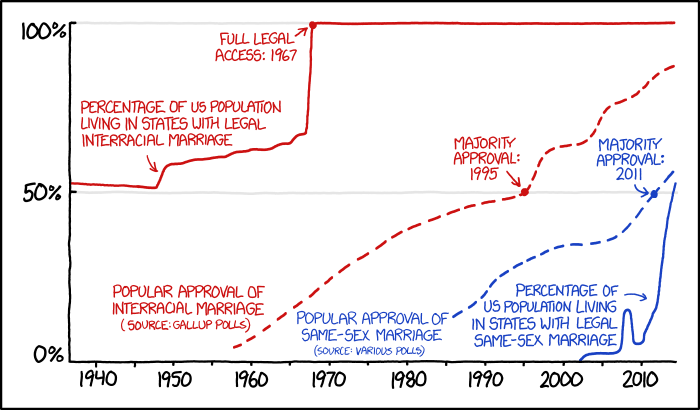
[A graph with the x-axis showing time in years from 1940 to some time after 2010 (presumably ca. 2014). The y-axis shows percentage of population. The graph has 4 lines, 2 solid and 2 dashed, with 2 different colors: red and blue. The red lines indicate statistics concerning interracial marriage, while the blue indicate statistics concerning same-sex marriage. The solid lines indicate population living in states where that type of marriage is legal, while the dashed lines indicate popular approval of that type of marriage based on various polls.]
[Solid red line:] Percentage of US population living in states with legal interracial marriage
[Dot on solid red line:] Full legal access: 1967
[Dashed red line:] Popular approval of interracial marriage (Source: Gallup Polls)
[Dot on dashed red line:] Majority approval: 1995
[Dashed blue line:] Popular approval of same-sex marriage (Source: various polls)
[Dot on dashed blue line:] Majority approval: 2011
[Solid blue line:] Percentage of US population living in states with legal same-sex marriage
[Interracial marriage is indicated as being more than 50% legal in 1940, with a very slight downward trend that spikes up slightly ca. 1948, then trends slowly upward to about 65% until ca. 1967, at which point it spikes directly to 100% legality and remains there through 2014. Popular approval of interracial marriage is below 10% in the late 1950s, rising steadily to approximately 40% in 1980, then continuing to rise more slowly to the majority approval point in 1995, and spiking up to about 65% ca. 1997, plateauing until ca. 2003, rising quickly again to about 75% ca. 2006 and rising generally upward to the final ca. 2014 statistic depicted between 85% and 90% popular approval. The visual effect seems to be a wide gap of time between legalization of and popular approval of interracial marriage. Popular approval appears to trail legalization by no less than 20 years at any given point.
Popular approval of same-sex marriage (according to “various polls”) is depicted first at about 15% ca. 1986, trending gradually upward until ca. 2000, where it plateaus between 35% and 40% to resume an upward trend ca. 2007, continuing steadily through majority approval in 2011 to a ca. 2014 value between 55% and 60%. The legality of same-sex marriage is indicated to start at 0% ca. 2002, then jumps quickly to plateau around 5% until ca. 2008, at which point it spikes up to between 15% and 20%, then plummets to just above than 5% by ca. 2009, jumping quickly back up to between 15% and 20% between ca. 2010 and 2011, then trending upward even more quickly to end at about 55% legality ca. 2014. The visual effect seems to be a more turbulent line for legality of same-sex marriage than any of the other trends, which also seems to be quickly closing on the popular approval trend. Popular approval has preceded legalization by nearly 20 years at certain points, but the trends appear to be closing and may intersect by 2015 or 2016.]