January 24, 2014
#1321: Cold explain

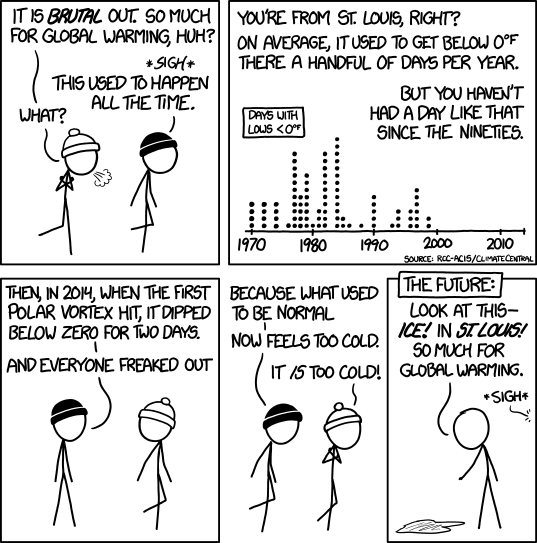
[It’s cold, two Guys wearing knit caps (one knit cap is white the other black) are walking outside and the White Knit Cap Guy is shivering.]
White Knit Cap Guy: It is brutal out. So much for global warming, huh?
Black Knit Cap Guy: *sigh* This used to happen all the time.
White Knit Cap Guy: What?
[A dot plot showing number of days with lows below zero Fahrenheit by year since 1970.]
Black Knit Cap Guy (off-screen): You’re from St. Louis, right?
Black Knit Cap Guy (off-screen): On average, it used to get below 0 °F there a handful of days per year.
Black Knit Cap Guy (off-screen): But you haven’t had a day like that since the nineties.
[Above the dot plot to the left is a label in a black frame:]
Days with lows < 0°F
[Below the dot plot are written the years:]
1970 1980 1990 2000 2010
[Below again is written in small letters:]
Source: rcc-acis.org/climatecentral
[Black Knit Cap Guy has stopped walking.]
Black Knit Cap Guy: Then, in 2014, when the first polar vortex hit, it dipped below zero for two days.
Black Knit Cap Guy: And everyone freaked out
[They continue walking.]
Black Knit Cap Guy: because what used to be normal
Black Knit Cap Guy: now feels too cold.
White Knit Cap Guy: It is too cold!
[Above the last panel is written in a black frame:]
The Future:
[Cueball is pointing at a patch of ice.]
Cueball: Look at this—ice! In St. Louis! So much for global warming.
Person off-screen: *sigh*