June 26, 2013
#1230: Polar/Cartesian explain

[Caption above the panel:]
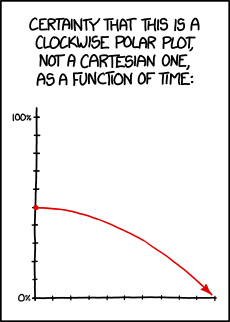
Certainty that this is a clockwise polar plot, not a Cartesian one, as a function of time:
[There is a graph. The Y axis is marked out from 0% to 100%. The X axis is unmarked. A red line starts at 50% and traces out a roughly parabolic trend downwards along the X axis.]