April 26, 2013
#1204: Detail explain

My Neighborhood’s Resolution in:
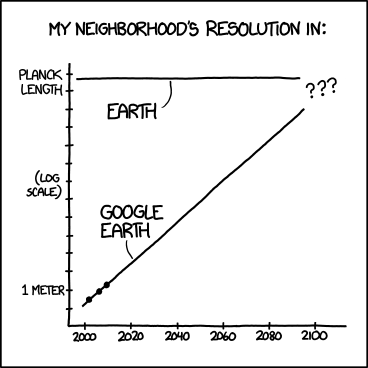
[A two-axis graph with years from 2000 to 2100 plotted on the x-axis and resolution from 1 meter to the Planck length plotted on a logarithmic scale on the y-axis. Three points in a line close to (~2010, 1 meter) are plotted at the bottom left of the graph; they have a strong positive correlation. Two trendlines are drawn on the graph; one is labeled “Earth” and remains constant at the Planck length over time; the other is labeled “Google Earth” and connects the aforementioned three points, extending upward in a straight line and approaching the Planck length around 2100. Both trendlines break up into question marks before the point they would intersect.]