December 4, 2013
#1299: I Don't Own a TV explain

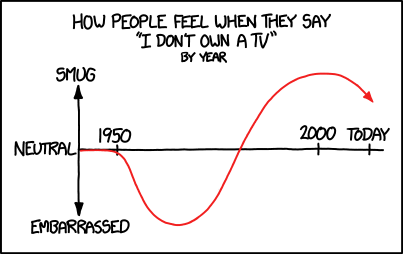
[A graph is shown with an x- and y-axis.]
How people feel when they say
“I don’t own a TV”
by year
[The x-axis is labeled: 1950, 2000, today.]
[The y-axis is labeled neutral at zero, smug at top, and embarrassed to the bottom.]
[A plot, similar to a negative sine curve between approximately 1960 and 2000, is shown in red, starting at 1950, moving into negative values, reaching the zero level again at the beginning of the 1980s, reaching its maximum shortly after 2000, and decreasing again until today. An arrow shows the current direction.]