October 23, 2013
#1281: Minifigs explain

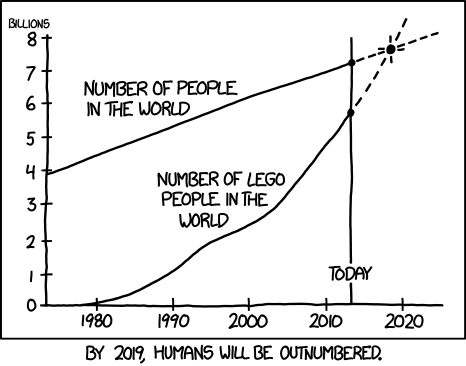
[Graph: x-axis 1980, 1990, 2010, 2020; y-axis 1, 2, 3, 4, 5, 6, 7, 8 billions.]
[Plot-line 1: Number of people in the world.]
[Plot-line 2: Number of Lego People in the world.]
[Label above the x-axis at 2013 reads “Today”.]
[Shortly before 2020, both plot lines cross.]
[Caption below the graph:]
By 2019, humans will be outnumbered.