June 4, 2012
#1064: Front Door explain

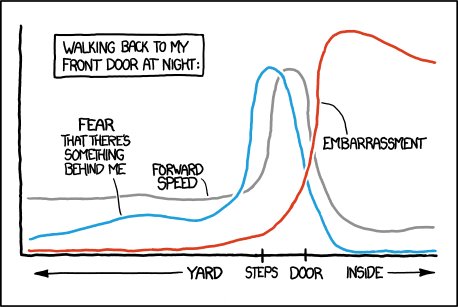
[A graph with three colored lines. There is no scale on the Y-axis but the X-axis represents geographic location and has four labels. From the Y-axis to around the midpoint is “Yard”, with an arrow from the word yard pointing left, at a point beyond the midpoint there is a tick labeled “Steps”, at a point after that is another tick labeled “Door”, and all points afterward are “Inside” with an arrow pointing right from the word inside, there are no tick for the first and last label. The three lines are all labeled with a small lines going from the label to the lines. The blue line begins to slowly increase from the start, with a slight dip further into the yard, and a steep increase right before the steps, maxing on the steps, and declining steeply at the door, bottoming out once inside. The gray line is at a steady medium height until it gets to the steps, at which point it shoots upwards, and then slowly declines once inside. The red line stays at 0 until just before the steps, where it begins to trend upwards, spikes at the door, and begins to slowly decline once inside. Above the curves to the left there is a black frame with the title of the graph:]
Walking Back to My Front Door at Night:
X-axis labels: Yard Steps Door Inside
Blue line: Fear That There’s Something Behind Me
Gray line: Forward Speed
Red line: Embarrassment