October 22, 2012

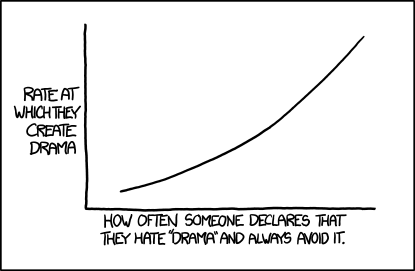
[A Cartesian graph labeled ‘How often someone declares that they hate “drama” and always avoid it’ on the x-axis and ‘Rate at which they create drama’ labeled on the y-axis. The graph is a slightly exponential curve sloping upwards.]