January 23, 2012
#1007: Sustainable explain

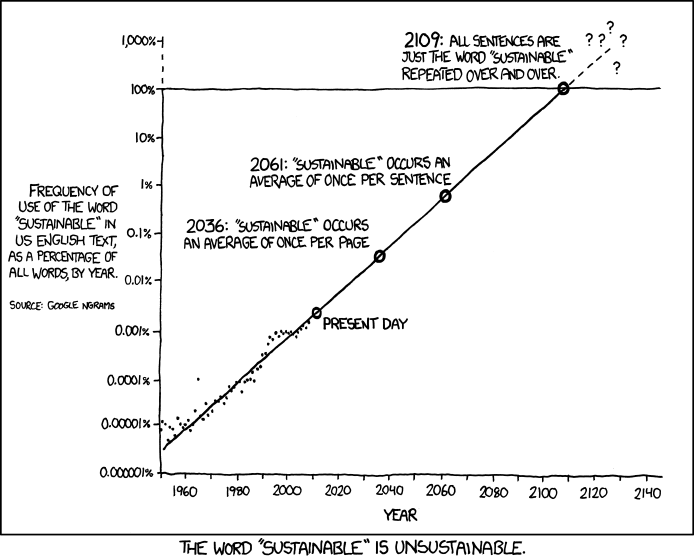
[A large two-axis scatterplot graph with a caption below. The y-axis displays percentages on a logarithmic scale from 0.000001% to 1,000%, and is labeled “Frequency of use of the word “sustainable” in US English text, as a percentage of all words, by year. Source: Google NGrams.” The x-axis displays years from 1950 to 2140, and is labeled “Year”. Plotted data points show a high linear correlation (effectively exponential due to being a log scale), ranging from approximately 0.000005% in 1960 to approximately 0.003% in 2012. A linear trend line is drawn through the data points, and is extrapolated to the end of the graph. Four points on this trend line are marked and labeled:]
(2012, ~0.003%): Present Day
(2036, ~0.03%): 2036: “Sustainable” occurs an average of once per page
(2061, ~0.5%): 2061: “Sustainable” occurs an average of once per sentence
(2109, 100%): 2109: All sentences are just the word “sustainable” over and over.
[The trend line continues past the year 2109, exceeding 100% and breaking up into question marks.]
[Caption below the panel:]
The word “sustainable” is unsustainable.