May 2, 2011
#893: 65 Years explain

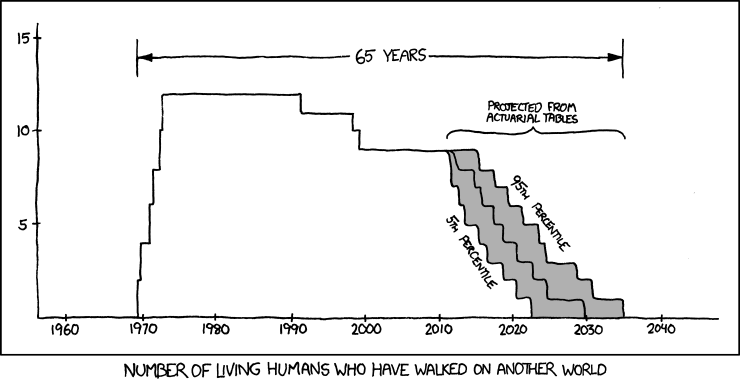
[A graph titled ‘Number of Living Humans Who Have Walked on Another World’ - its y-axis is numbered 5, 10, 15, its x-axis increments every ten years from 1960-2040. The line of the graph has a bracket above it that says ‘65 Years’, starting at 1969, ending in 2034.
The line starts at 1969 and increases steeply to 12 by 1972. It then plateaus until the early nineties, declines gradually to 9 between 1991-1999, and then plateaus again.
From 2011-2035, which is labeled ‘Projected Actuarial Tables’, the line branches into three and begins to decline more steeply to zero. The area between the first and second branch is shaded and labeled ‘5th percentile’ and the area between the second and third branch is shaded and labeled ‘95th percentile.’]