May 2, 2008
#418: Stove Ownership explain

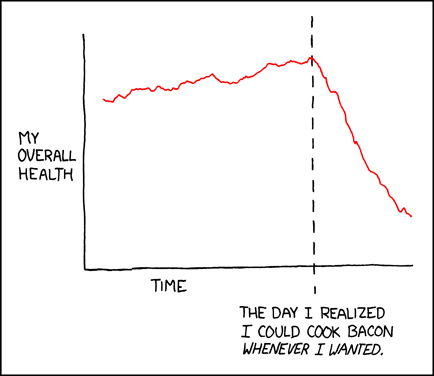
[A hand-drawn graph is shown.]
[On the y-axis:]
My overall health
[On the x-axis:]
Time
[The graph is generally steady rising through 3/4 of the x-axis, where it begins a steady decline. A stapled line marks the start of this decline. Below where the line crosses the x-axis, this decline is labeled:]
The day I realized I could cook bacon whenever I wanted.