January 2, 2008
#365: Slides explain

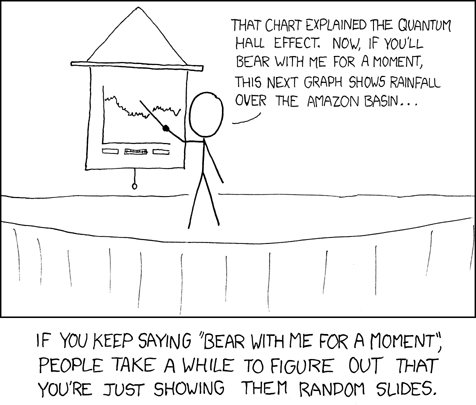
[Cueball is standing on a stage, pointing at a line graph using a pointer.]
Cueball: That chart explained the quantum Hall effect. Now, if you’ll bear with me a moment, this next graph shows rainfall over the amazon basin…
[Caption below the panel:]
If you keep saying “bear with me for a moment” people will take a while to figure out that you’re just showing them random slides.