April 23, 2007
#252: Escalators explain

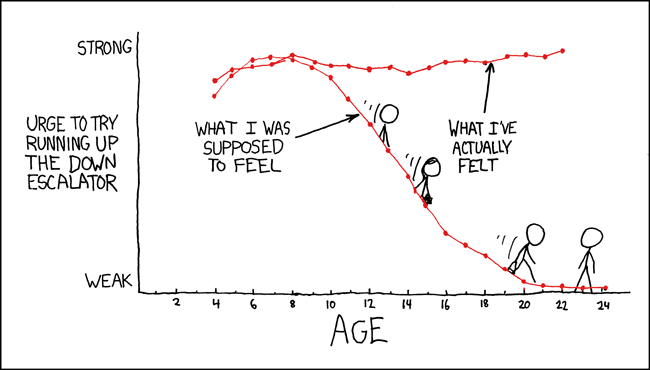
[A graph with y-axis titled “Urge to try running up the down escalator,” with “weak” by the bottom and “strong” by the top. The x-axis has every two years labeled and every year signified by a smaller mark, which stops at 24. A red line with “What I was supposed to feel” with points at every line rises, peaks at 7 years old, then falls “tangent graph” shaped until the end. The graph is shaped like an escalator with the last Cueball having just dismounted. Along this line are shown various Cueball-like figures at 12, 14, 20, and 24. A second red line runs “What I’ve actually felt,” which stays consistently high.]