January 18, 2006
#54: Science explain

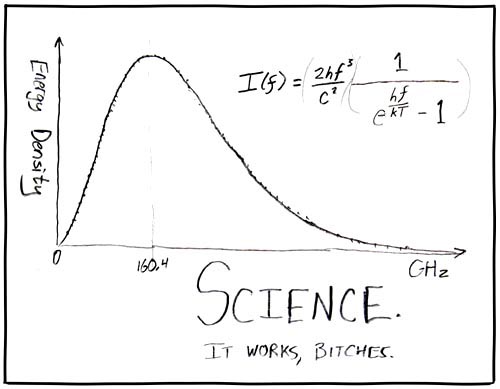
[A graph with a curve that begins at zero, then peaks at a given frequency, indicated via a thin vertical line, and then fades down towards zero. It is possible to see the data points, which fit the curve perfectly. The y-axis is labelled. Along the x-axis, the zero point and the frequency where the peak has its maximum are labelled and close to the arrow the unit of this axis is written.]
y-axis: Energy Density
Along the x-axis:
0
160.4
GHz
[Above the graph to the right is the following formula, with the last inner parentheses only included to make the formula clear, since in the drawing the fractions are written above and below horizontal lines:]
I(f) = (2hf3/c2)(1/(ehf/kT-1))
[Below the graph is written the following:]
Science.
It works, bitches.